
Evolving design automation in the automotive industry
The use of design automation is evolving to provide greater productivity in the automotive industry.
By Sjon Moore, Mentor Graphics.
Engineers have typically optimised Electrical Distribution Systems using unsophisticated and manual spreadsheet tools. Any detailed feedback on critical metrics such as cost or weight typically relies on another organisation and requires week or months. The resulting EDS is inevitably sub-optimised, not due to a lack of engineering ability, but rather the tools available. To ensure that the EDS design is optimised from the outset, the design environment itself must be enhanced. There are four key attributes to this design environment.
Firstly, automation is required to ensure that designs are synthesised rather than manually created. Secondly, the ability to measure and assess the design must be available in the design, while the engineer is designing. Thirdly, there must be multiple alternatives to view the resulting data to aid the engineer’s understanding. Measuring a single design is important, but the ability to compare alternatives, or even the same design through time is required. Finally, the measurements provided must become enriched and more accurate as the design matures. Estimations in the architecture space will become exact figures in the harness manufacturing space.
Design automation
Automating the design tasks allows time to run multiple iterations, providing more opportunity for optimisation. It also ensures repeatable results so that variation between alternatives is isolated to only the intended differences, and does not include manually induced variation. The thought and design processes need to move to the platform level to fully automate the wiring design process. At the platform level, it becomes simple to automate the synthesis of wiring designs.
In the non-automated design process, the designer has to interact with the design as it progresses and make many decisions at the design moves on, usually using rules to guide the decision process. By abstracting the design process, the designer is now able think in terms of the rules and guidelines rather than their specific application. Capturing these rules allows automation to perform the mundane tasks of applying them. Ensuring that the rules exist in a re-usable format not only improves the design process, but also removes over-reliance on a small subset of highly skilled engineers.
The designer can also think in terms of the entire platform, rather than a single design at a time. The captured rules can then be applied to the platform context and the wiring is created for the user. The decisions about which harness through which to route, what wire size and material to use, and whether to use a splice or a multiterm are made for the user rather than by the user. And these decisions are made with respect to all of the orderable configurations. What results is the synthesis of the entire wiring design.
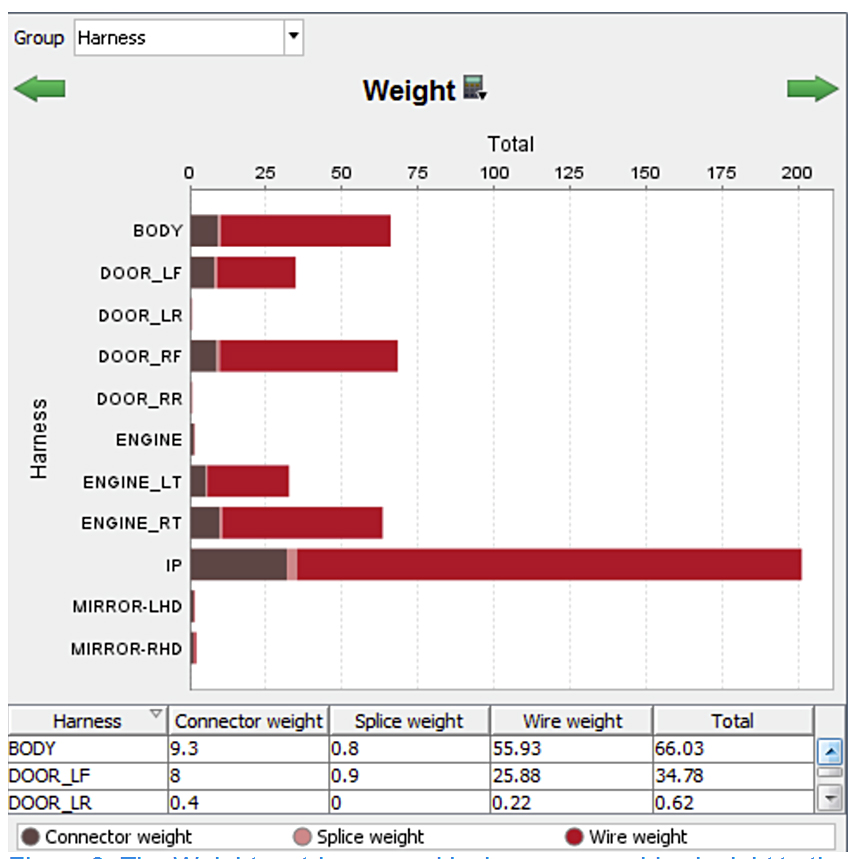
Figure 1 - Weight is a common metric to include for systems optimisation.
Synthesis of the wiring design through automation significantly increases the number of scenarios the designer can create and test. If the designer wishes to understand the impact of moving an inline to the opposite side of the vehicle, it is trivial to make the change in the platform design environment, then re-synthesise the wiring. Even changes to the rules and guidelines themselves that would normally be a difficult task to implement, is now a minor undertaking.
Measuring and assessing
A design can only be assessed if there are methods of measuring the design; it’s impossible to optimise a design if it can’t be assessed and evaluated. And the more precise and accurate the measurement, the better the decisions the designer can make. Generally, metrics are chosen based on the industry, the enterprise, or even the design type itself. Many metrics are engineering related - weight, cost, temperature - however business metrics can be defined as well, such as maximising profit.
Metrics can also be created that will point out sub-optimal aspects of the design. For example, a metric could be created that simply reports the number of pass through wires in the platform. These are wires in a harness that simply go from one inline to another. A metric of this type could help the designer analyse the platform design and guide them to alternative solutions. The point is, metrics can also be used to help guide the designer to areas they should give closer consideration.
Measuring and assessing a single design or a single decision is valuable, but being able to compare results from multiple alternatives is equally so. Overlaying two or more sets of results, then seeing how they compare allows the designer to understand which is better, and under what conditions. As mentioned earlier, design automation gives designers time to make comparisons for multiple design alternatives. Perhaps a review of the metrics has suggested that a slightly different harness partitioning might result in lower cost and weight. An alternate design can be created then updated to match this new design. Design automation will then very quickly update all of the wiring data based on this new platform design.
The ability to then compare these two designs will enable the designer to know definitively if they were correct. Assuming they were and the new design is superior, it is already designed for them. There is no need to then implement it across many wiring designs. The work is already done. It simply becomes the design of record.
Design evolution
Understanding how a design has evolved over time can be valuable, which means that the tool must enable the designer to save snapshots of the design. Comparing these snapshots will inform the designer of how it has evolved. Perhaps the design was initially fully optimised, but late requirement changes have negatively impacted the metrics. Understanding how these changes have caused the design to drift provides design knowledge of a historical nature that could be useful in attempts to re-optimise the design, or in future platform optimisation efforts.
A quick design example using Mentor Graphics’ Capital suite will illustrate the value of automation and its ability to free time to evaluate options. In this example, the designer wants to investigate replacing certain 12V systems with 48V systems in an effort to save cost and weight. The designer swaps out the systems, as an example of working at the platform level by deciding which system designs to integrate into the platform. Placement of the new devices around the vehicle is done by rules that drive placement preferences. Or, if the devices are new the user can very easily manually place them or create new placement rules. Likewise, automatically placing grounds will connect them to available ground points.
The new system designs will invalidate some wiring and create the need for some new wiring. Design automation can simply update the existing wiring and synthesise new wiring based on the previously defined rules. This is communicated to the designer continuously as the visual and tabular Count metric is dynamically updated as wiring is deleted and added.
What the designer has done up to this point is used automation to very rapidly create a design alternative. This will free up time to fully optimise the design and increases design knowledge at an earlier point. Now the design can be evaluated. One of the questions that will inevitably be asked is are there any failure modes that were not considered; analysis can answer this.
With a complete wiring design that represents the newly implemented design, automation will be used to create a complete Failure Mode & Effect Analysis (FMEA) report. Reports of this type typically take weeks of manual effort to create and can easily miss failure modes and their effects. Capital offers automation that can test all of the possible switch and failure combinations across the various configurations to uncover all failure modes.
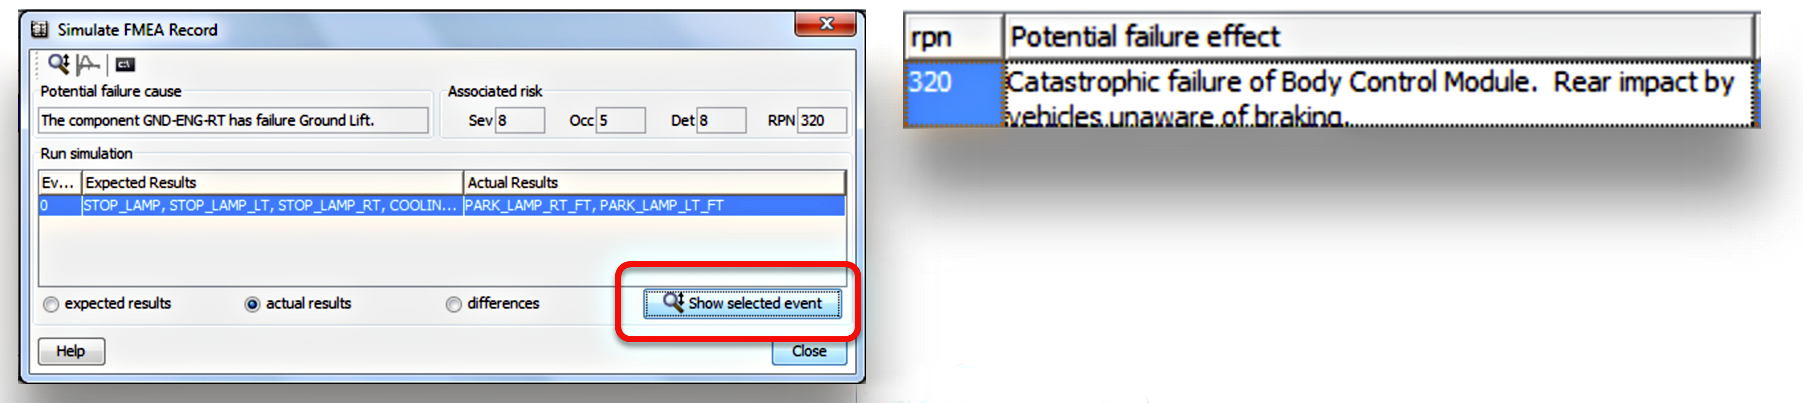
Figure 2 - Automatically generated FMEA highlighting the failure effect associated with the disconnected ground.
In this example (Figure 2), the FMEA is reporting a very high risk priority number value related to a failing Body Control Module. This occurs when a seemingly unrelated ground in the front of the vehicle is lifted (meaning it is not connected to sheet metal and is therefore floating). The designer can replay this specific record on the FMEA and observe via colour overlays on the platform where these failures are occurring. Investigating the ground point itself, the designer realises that some of the new 48V grounds have been combined into a single ground location with several 12V lighting grounds. At this point, it becomes easier to visualise the problem by observing the design in a logical form rather than a platform context. The designer opens the appropriate logical design and continues the analysis of the issue in the same environment and without interrupting the thought processes.
In Figure 3, the entire platform is schematically represented, and colour overlays highlight the FMEA results. From the diagram, it becomes clear that a sneak path exists through the bulbs. When a 48V load is active and the bulbs are not, current will sneak through the bulb and place approximately 20V on the lighting output driver of the Body Control Module. It was not designed with this failure in mind and the module is damaged.
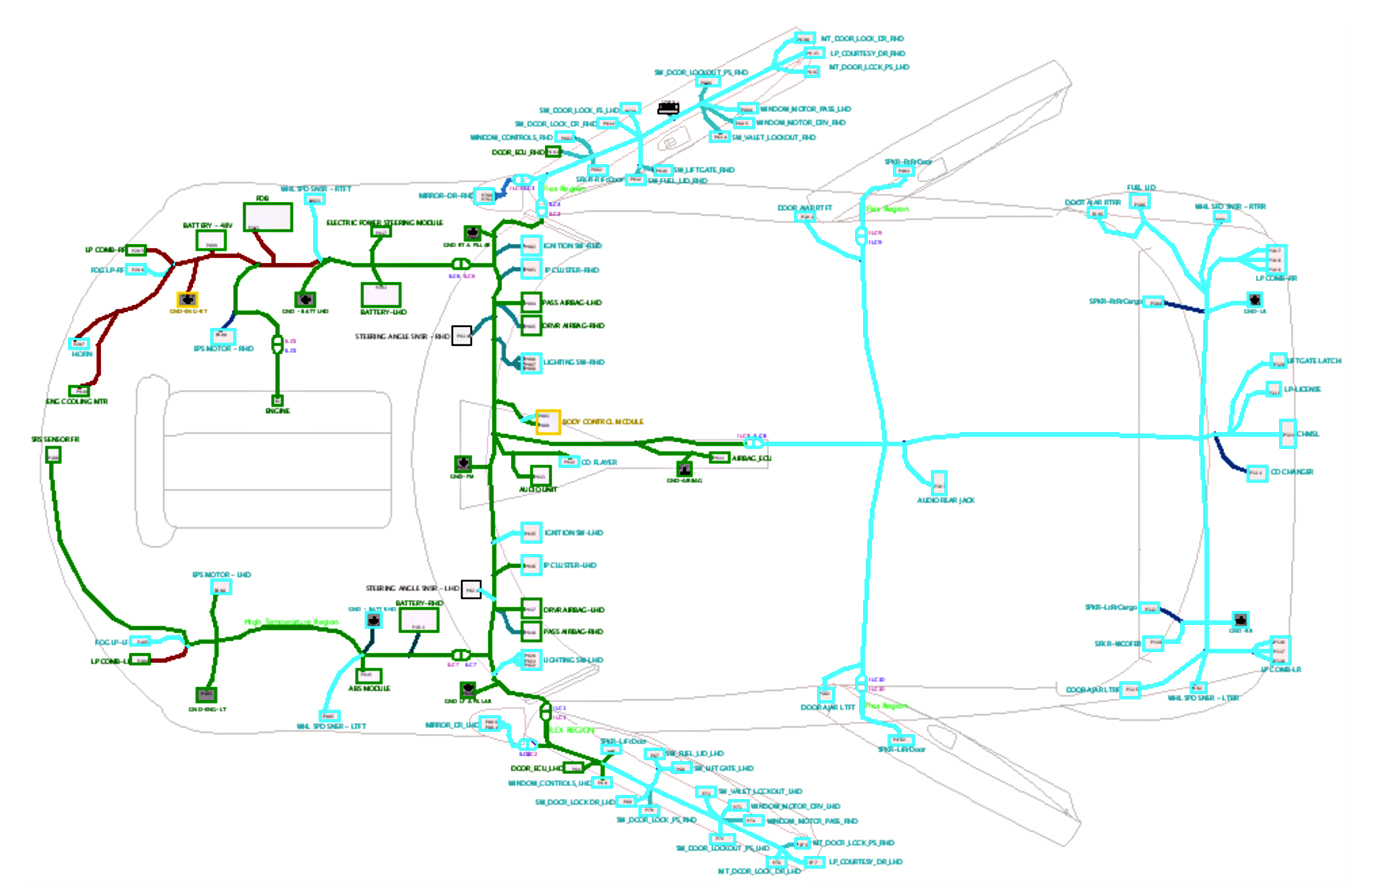
Figure 3 - Mentor Graphics Capital has found the error and highlighted it so the designer can take corrective action.
To test this, the designer can simply separate the grounds on the platform design and re-synthesise the wiring. While doing so, the designer observes the Cost metric increasing due to additional wires and ground point attachments being required. Re-running the FMEA will show that the destructive failure effect has been eliminated. Note that the designer learned something valuable not only about this specific design, but about implementation of 48V technologies in general. Care must be exercised with combined 12V and 48V grounds, especially when a sneak path is available. This is intellectual property that now belongs to the organisation. The designer can then create a rule driving the placement and combination of grounds such that this does not occur in the future.
Once the quality of the design is assured, the Count metric can be examined to ascertain if any savings has been realised. Figure 4 shows the Count metric, displayed by wire size. Comparing that to the original design, the number of wires eliminated (or added) can be found and the cost estimated.
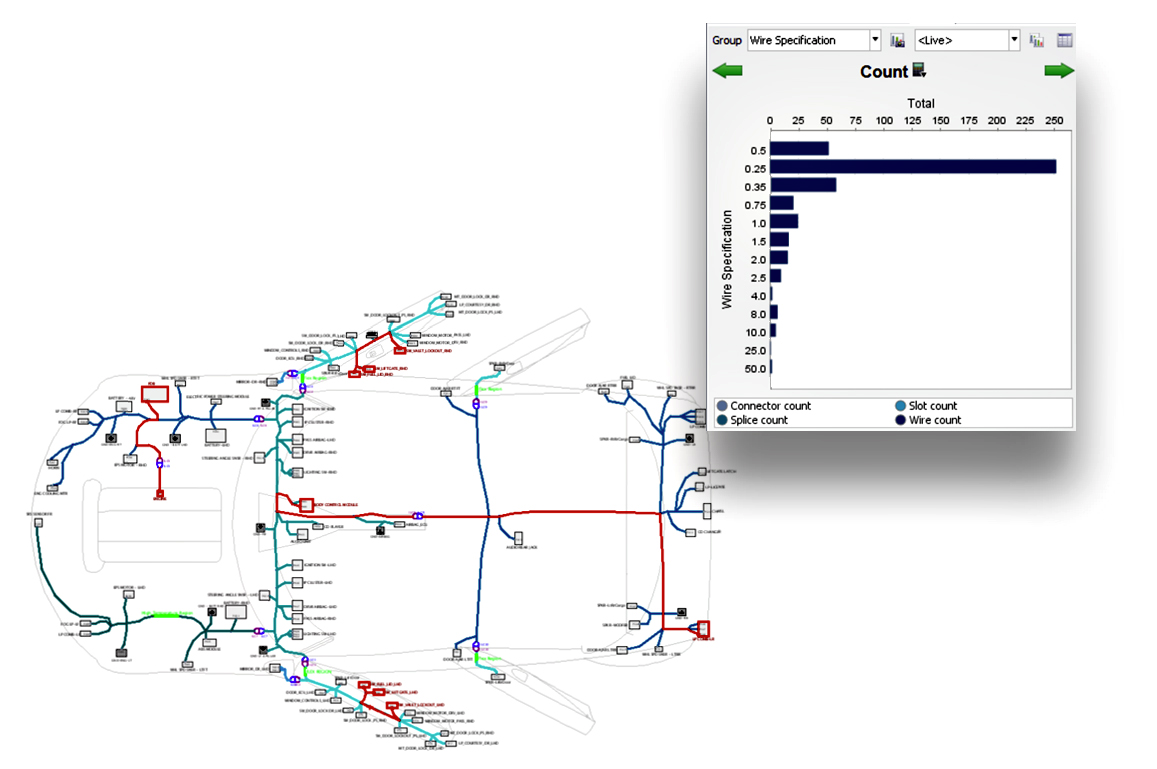
Figure 4 - The Count metric is displayed for the revised design of mixed 12 and 48V systems.
Design automation abstracts the design process and synthesises wiring solutions. It does this to ensure consistent results that are an absolute requirement for effective optimisation efforts. It also allows for a large number of alternatives to be considered very quickly. The better the method of measuring the design, the more design knowledge can be acquired. Any tool that enables optimisation must have significant capabilities with regards the measuring, assessing and comparing design alternatives and changes through time.
Mentor Graphics Capital has been used as an example of a tool that supplies the automation and intelligence to move designs into the next generation. The automation is available for each step of the design process, allowing designers to optimise any of a number of design criteria, such as cost, weight, or other factors. Employing such a solution will result in savings of time and cost, and allowing the designer to explore options that weren’t possible in the past. The result is a significantly more optimal design than was ever possible using manual methods.
Product Spotlight
APV1111GVY
Panasonic

Panasonic PhotoMOS® Photovoltaic MOSFET High-Power Drivers
| SKU: | |
|---|---|
| Stock: | 3490 |
| Cost: | $3.95 |
