
Data logger software analyses shocks and jolts
Specialising in analysing shock events and jolts, the new MSR ShockViewer data logger software allows you to clearly present extensive measured data, as well as quickly analyse and conclusively document critical events. During transport, cargo is subjected to a multitude of external impacts that may cause it to sustain damage.
Mini data loggers and the new MSR ShockViewer software, which is manufactured by the MSR Electronics Company in Seuzach, can be used to record, store and analyse the most important physical impacts on cargo (acceleration, temperature, relative humidity, air pressure, light). The recorded data provides continuous information on the transport conditions of a goods shipment. This makes it easier to optimise logistics concepts, as well as quickly and cost-effectively settle any liability and quality assurance issues.
Shocks are the most damaging transportation stresses
The most important physical parameters that should be monitored in a transport and logistics chain are accelerations, shock events, jolts and vibrations, as they may have a very negative impact on the mechanical structure of any industrial object or commodity. In order to be able to accurately record such transportation stresses, an associated acceleration value should be recorded more than 1,000 times per second in order to be able to capture and analyse vibrations in their frequency characteristic. Of course, this is to be done in all three geometric axes (x, y, z) in order to obtain acceleration values in all directions.
The MSR165 mini data loggers, which feature shock recording up to 15 or 200g and a measurement frequency of 1,600/s, are proving particular successful in the logistics industry.
The 3-axis acceleration sensor starts recording data either when an acceleration threshold is exceeded or at a set time. 32 measured values are recorded even before the shock event takes place, in order to ensure that the history of the shock can be examined during a g-analysis. As a result, the user not only knows that a shock has occurred but also identifies the exact chronological sequence of the shock.
Accurate analyses expose perpetrators of damage
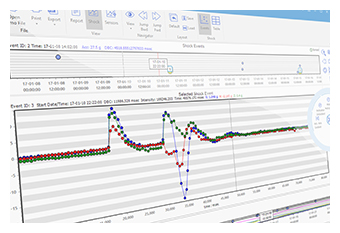
The logger data can then be analysed very accurately – be it in order to ascertain damage or to improve the device’s structure or transport packaging – using the new, intuitive MSR ShockViewer software. It can also be used to clearly present extensive recordings taken by the MSR165 logger, as well as quickly analyse and conclusively document critical events, supported by sophisticated graphical zoom and navigation functions. This way you can examine both the data curve and the measuring points of every individual shock and export the relevant data.
All measured values are given an exact 'timestamp', which can subsequently be used to reconstruct the time of an event accurately to the second, which is of great significance as evidence. Other environmental data, such as the temperature, humidity, pressure and light can also be viewed and organised clearly in a chart in the MSR ShockViewer. A single click is sufficient to call up a report.
Product Spotlight
APV1111GVY
Panasonic

Panasonic PhotoMOS® Photovoltaic MOSFET High-Power Drivers
| SKU: | |
|---|---|
| Stock: | 3490 |
| Cost: | $3.95 |
